Sunnyside Reporting
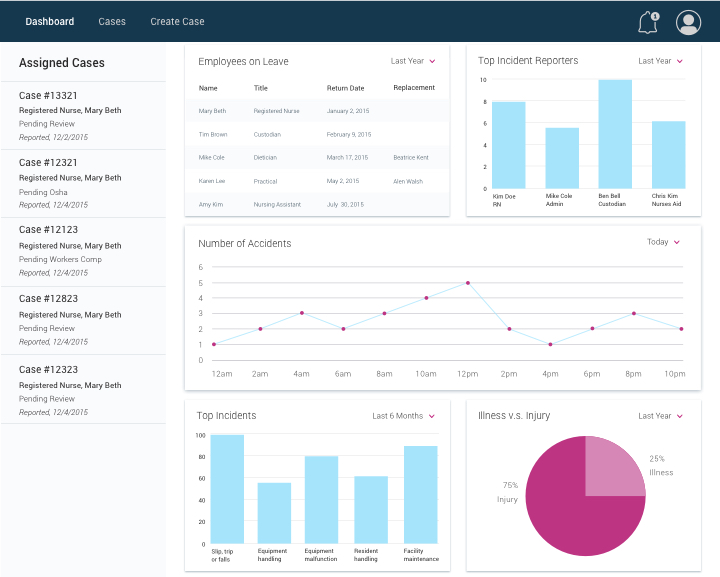
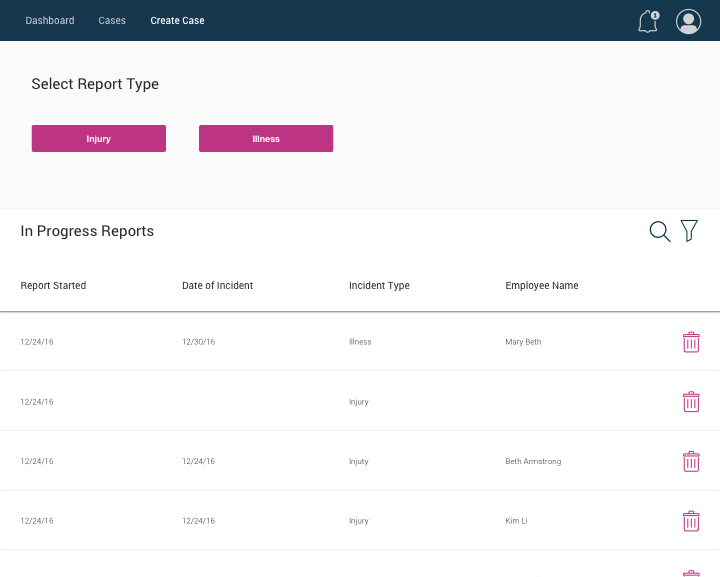
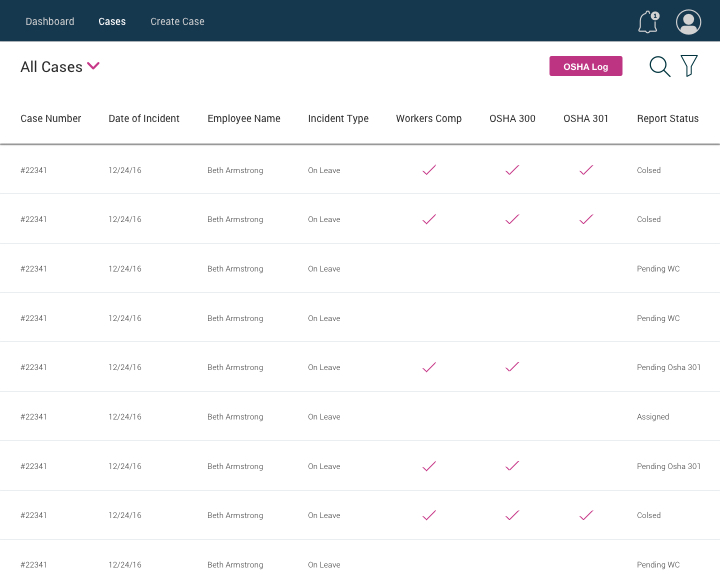
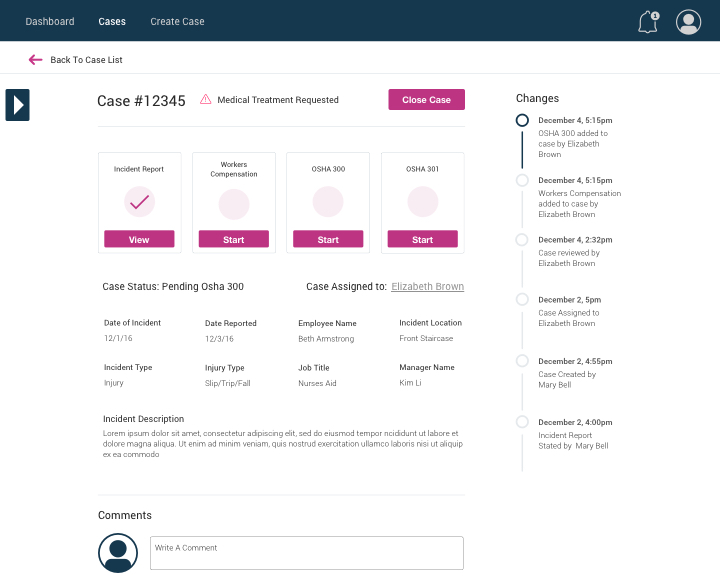
Sunnyside Reporting is an online dashboard and reporting tool for nursing home administrators. The purpose of Sunnyside Reporting is to allow administrators to view and edit case information as well as report employee illnesses and injuries. With this website, nursing home administrators will be able to create an account, login/logout of the system, edit their personal profile, view cases, fill out and submit injury, illness, OSHA and workers’ compensation reports, save an in-progress report, change the status of reports, view report analytics and append cases.
Goal
Create a dashboard and reporting tool for nursing home administrators
Role
User experience designer, user interface designer
Team
This was an individual project
Process
I began this project by completing research on nursing home reporting systems. I conducted primary and secondary research, interviewing a nursing home physical therapist and a hospital nurse. After learning about different reporting systems, I began creating task flows for the administrator dashboard and reporting portal. Task flows helped me visualize how different tasks might be accomplished within the website. When my task flows were complete I began drafting a sitemap. Creating a sitemap allowed me to view the website as a whole and clarify how the website would function. With a clear idea of how the website should work, I began sketching wireframes with pen and paper. After creating several versions of sketched wireframes I began digitizing them with Sketch. When the wireframes were complete, I annotated them with PowerPoint. Annotating gave me time to analyze the functionality of each element on the website. After reviewing the annotated wireframes I began adding design. The final step in my process was to create a prototype with InVision.
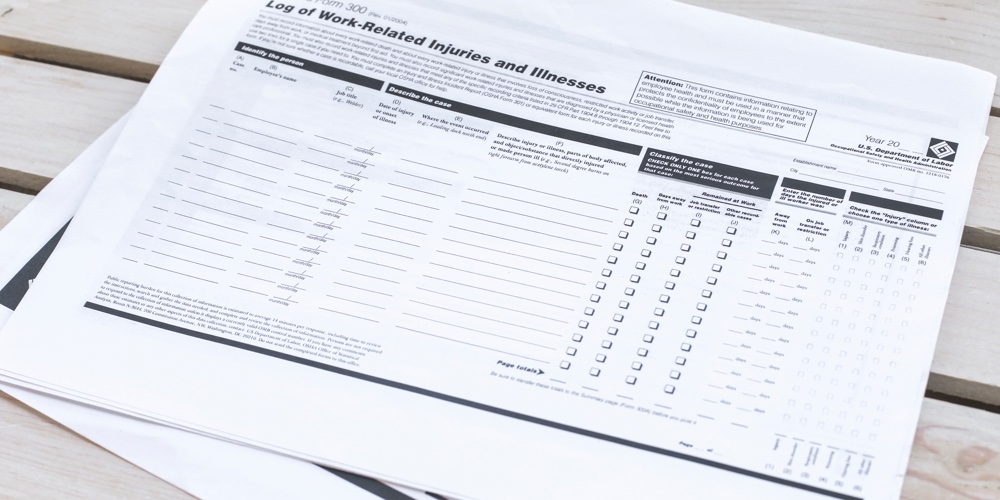
Research
Conducting primary and secondary research helped me understand what would assist a nursing home administrator complete their work more efficiently. Reading information online gave me an understanding of how nursing homes work and the different types of staff members who work there. I also learned what types of injuries and illnesses nursing home staff can receive while working. Interviewing someone who worked in a nursing home facility expanded this knowledge and showed me what type of information would be necessary to view on a dashboard.
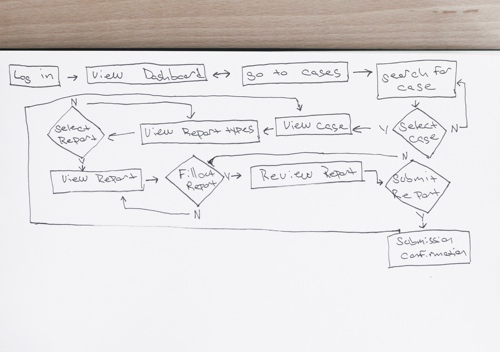
Task Flows
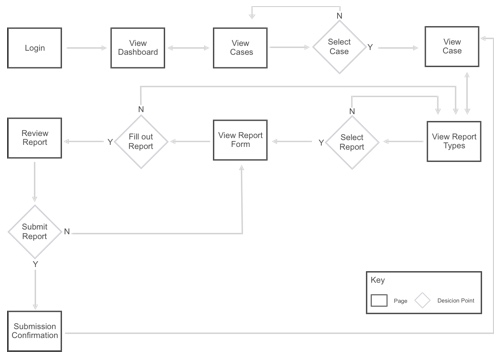
Keeping my research in mind I began creating task flows. I first used pen and paper to sketch how users would create and append reports. Task flows allowed me to view a visual representation of how nursing home administrators would complete different tasks. After some thought and several iterations I solidified my task flows and created digital versions. This step allowed me to consider how a user would move through the website to complete different tasks.
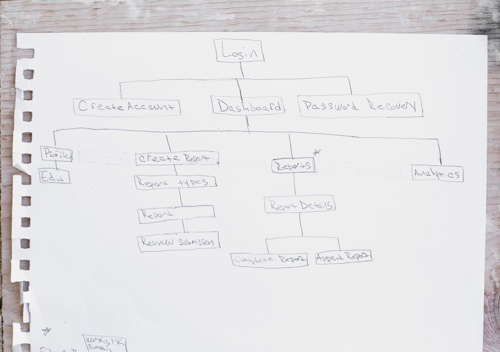
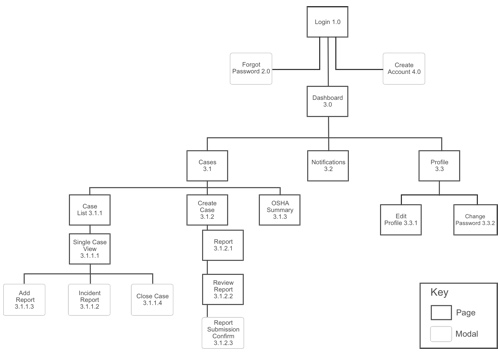
Sitemap
Using my task flows as a starting point I developed a sitemap for Sunnyside Reporting. I first sketched the sitemap with pen and paper, then digitized it with Sketch. This process helped me organize the page hierarchy of the website.
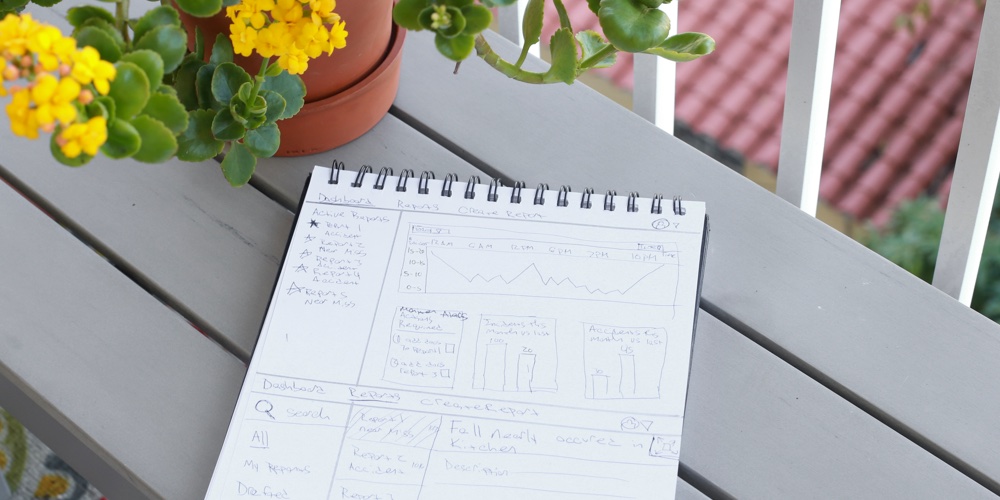
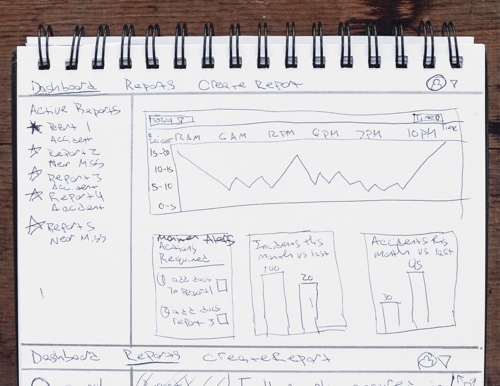
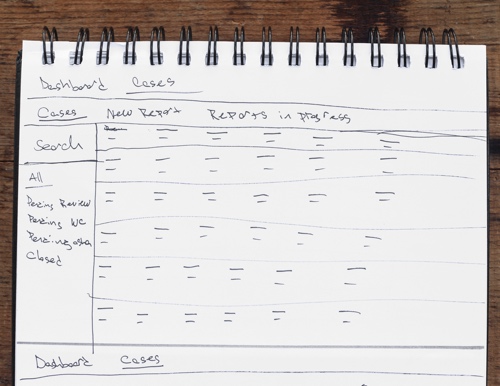
Sketches
After creating my sitemap, I began sketching wireframes with pen and paper. This allowed me to quickly create several iterations of wireframes. Sketching allowed me to try different ideas and compare them, analyzing which layouts would be most effective in assisting users to efficiently complete their tasks.
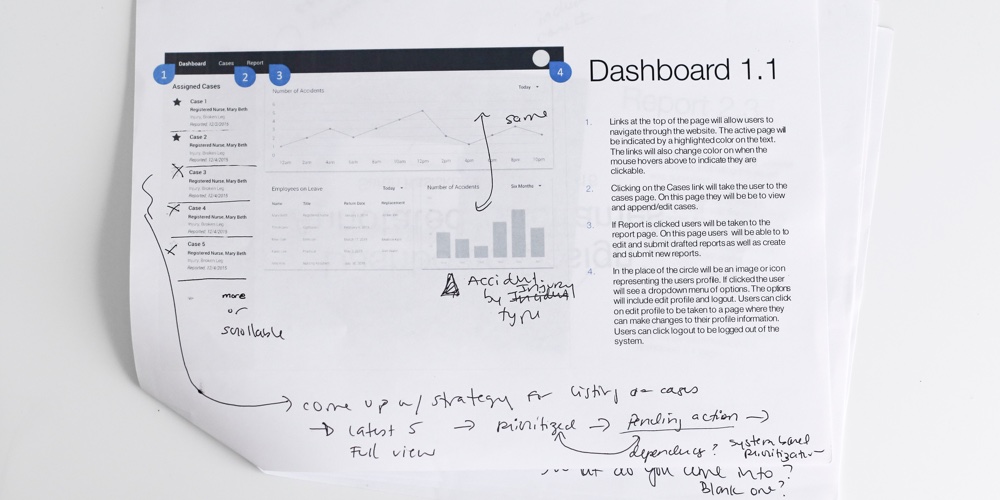
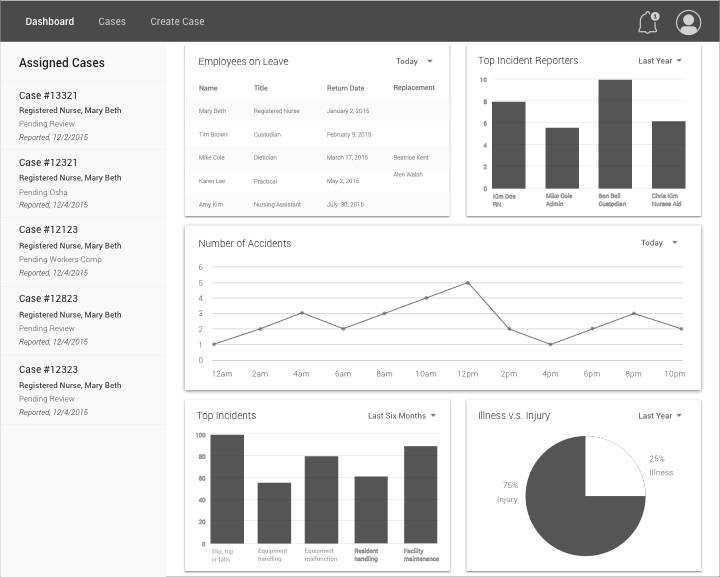
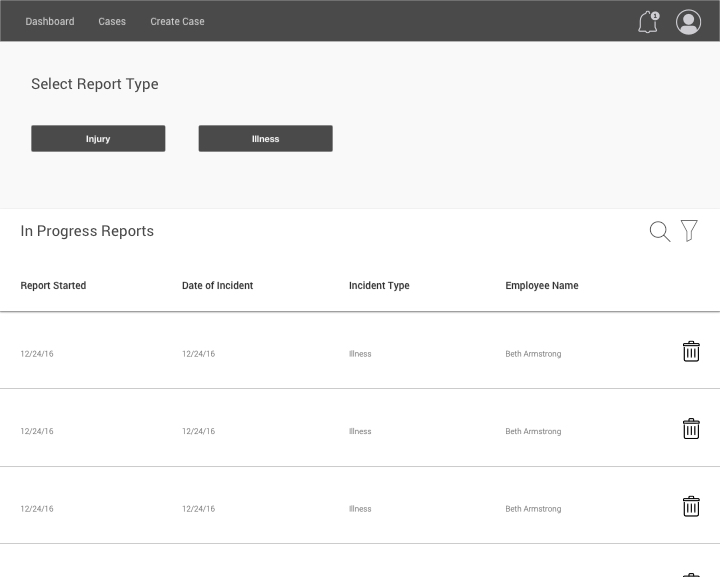
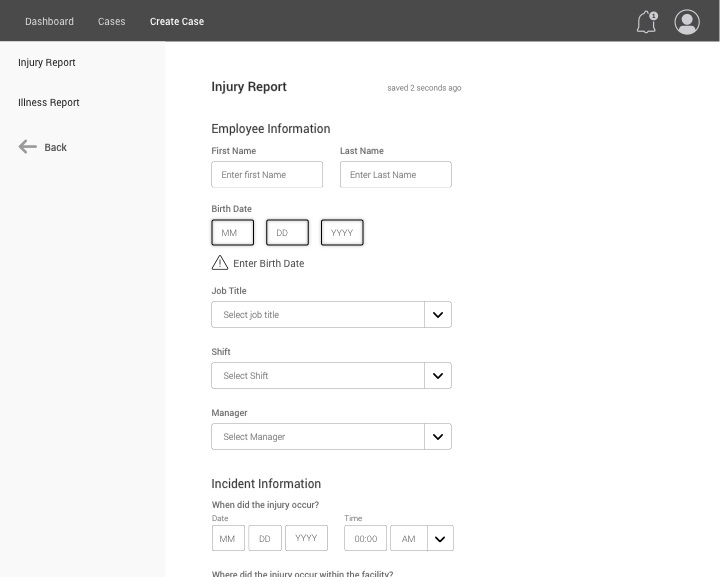
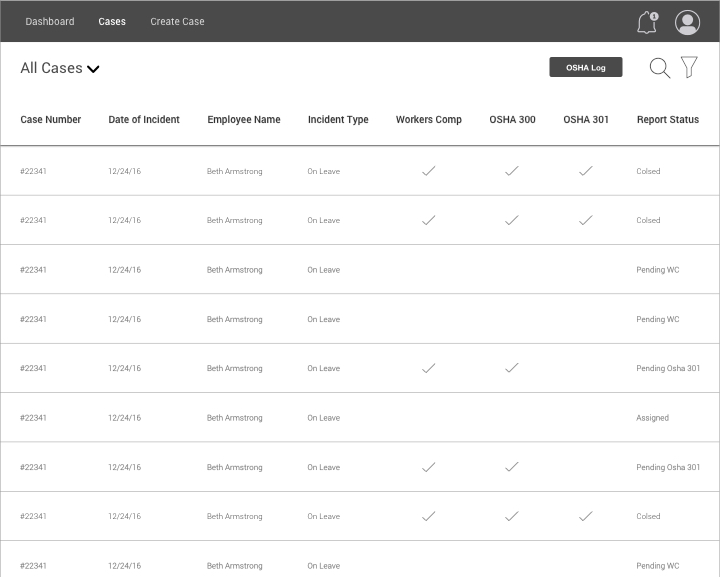
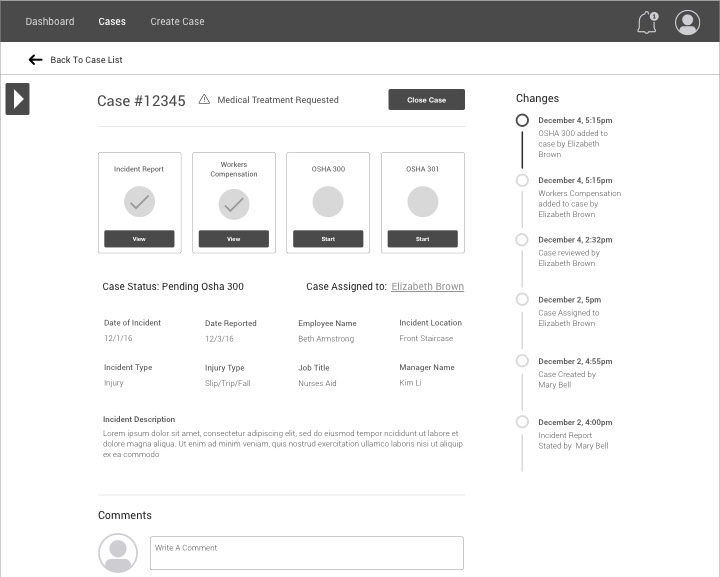
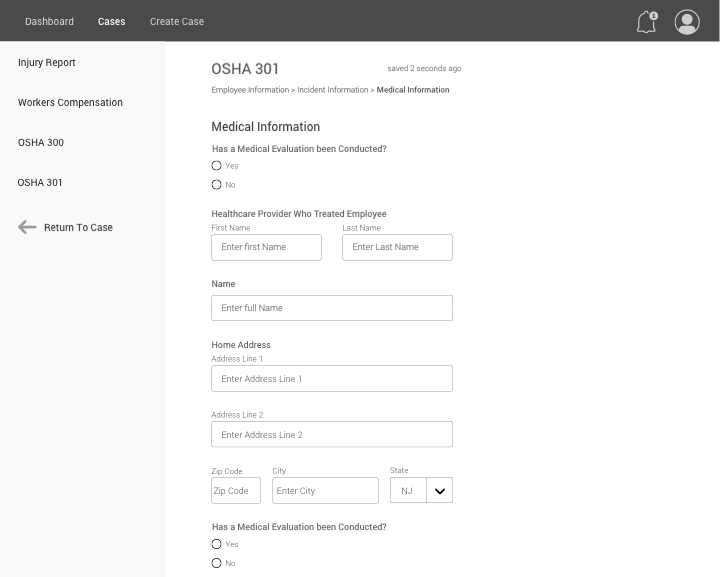
Wireframes
I solidified my sketches by creating digital versions in Sketch. While digitizing my sketches, I made edits to the wireframes, enhancing the usability of the website. When the wireframes were complete I annotated them in PowerPoint to explain the different interactions on each page.
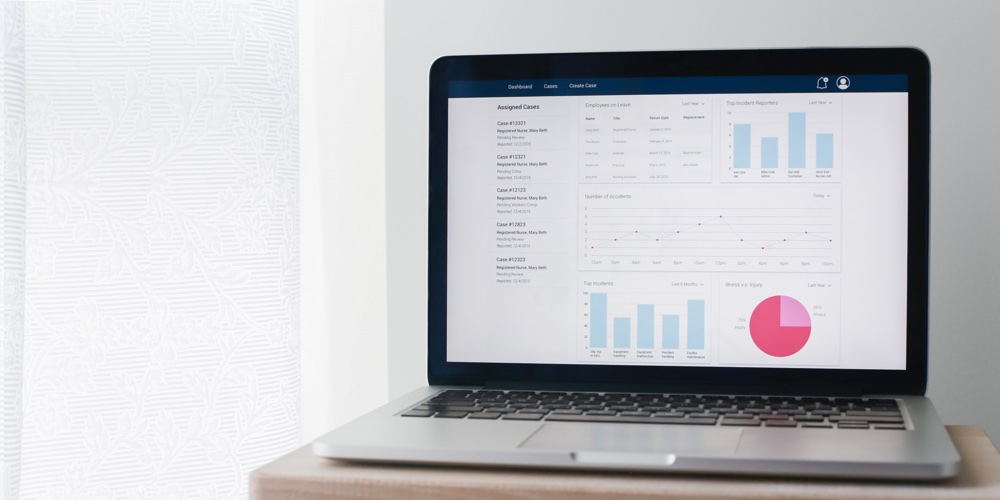
Design
The next step in my process for Sunnyside Reporting was design. Using my completed wireframes as a framework I added layers of color and design in Sketch.
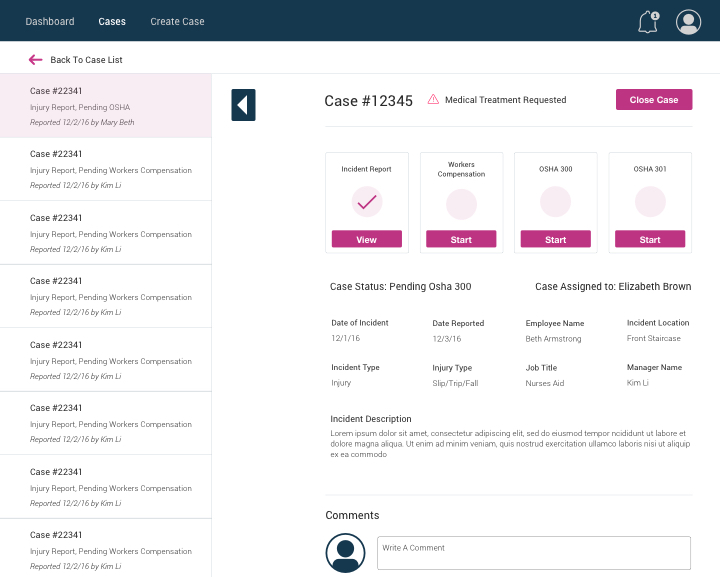
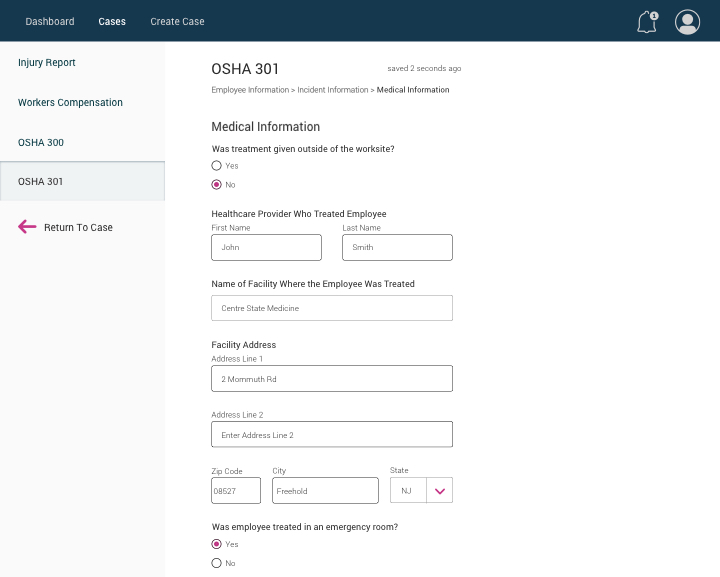
Prototype
When the designs were completed I prototyped the website in InVision. This helped me recognize and solve any issues with the functionality of the website.
View Additional Projects
Blueline
Blueline transforms the standard public safety radio into a radio application for police supervisors.
Sunnyside Reporting
Sunnyside Reporting is an online dashboard and reporting tool for nursing home administrators.
On a High Note
On a High Note is an interactive experience merging music, neuroscience and technology.
Homework Forecast
The Homework Forecast assists users deciding when they should complete their homework.